Case Study: Splitting Events into Smaller Subsets
Problem: Most of our events are from 2 minute long duty cycled recordings, but some are from continuous recordings and are longer than two minutes.
Solution: Let’s split the longer events into smaller 2 minute events, and we’ll add on _1, _2, etc. to the event name for events we split up
First let’s take a look at our problem. The checkStudy function checks for possible
errors in your event data. It is run automatically after you process your data, but we
can also use it on its own. Here we can have it check if any events are longer (in seconds)
than some maximum value we specify. This is useful if your data is from duty-cycled recordings,
since no events should be longer than your recording length.
longEvents <- checkStudy(myStudy, maxLength = 120)
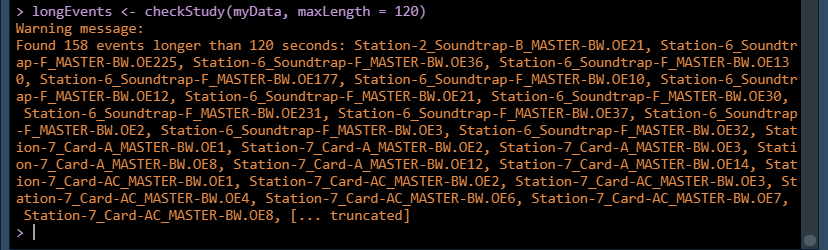
Looks like there are a lot, but this is because we know our dataset has a mix of duty-cycled and
continuous recordings. We want to be able to find these longer recordings and split them up
into a set of 2 minute long events instead of having one longer event. Our plan of attack is to
go through each event, find the start and end time of that event, and if that event is longer than
120 seconds break it up into a series of shorter events by using PAMpal’s filter function
to filter by UTC.
First let’s write a couple helper functions that will make our code neater and easier to follow
down the line. getTimes is going to take an AcousticEvent and just return all the detection
times (UTC). We’ll also keep track of the UID just in case we need it.
getTimes <- function(event) {
    # get all the detector data in this event
    allDets <- getDetectorData(event)
    # This goes through all of the $click, $whistle, and $cepstrum detectors if present
    justTimes <- bind_rows(lapply(allDets, function(x) {
        x[, c('UID', 'UTC')]
    }))
    justTimes
}
timeToStartEnd is going to take in a vector of UTC times (like from the output of
the getTimes function we just wrote) and turn it a list of start and end times for
our new shorter events. We start at the beginning of the event and just keep adding
120 seconds until we have passed the end of the event.
timeToStartEnd <- function(time, length = 120) {
    range <- range(time)
    lenSecs <- as.numeric(difftime(range[2], range[1], units='secs'))
    # Figure out how many events of length "length" we can have
    numSplits <- ceiling(lenSecs / length)
    # Each event starts some multiple of length from the original start
    start <- range[1] + length * 0:(numSplits-1)
    # Doesnt matter that the end is different than the actual event end
    # here since we are just using these times to filter later
    end <- start + length
    list(start=start, end=end)
}
Now we’re ready to create our new list of shorter events. Hopefully you can follow along with the comments in the code.
# We're going to use a for loop, but first we're going to create
# a place to store our output for the new events
newEvents <- vector('list', length = length(events(myStudy)))
for(i in seq_along(newEvents)) {
    # One event at a time, use our functions from earlier to get the
    # start and end times for our neew times
    thisEvent <- events(myStudy)[[i]]
    thisTime <- getTimes(thisEvent)
    thisStartEnd <- timeToStartEnd(thisTime$UTC, length=120)
    # If it only made one start/end, we don't need to change anything!
    if(length(thisStartEnd$start) == 1) {
        # The "list" part might look weird, but its because when we are breaking
        # up events we are going to be storing list sof events in each "newEvents"
        # spot, and we'll plan on "unlisting" them at the end of this process
        newEvents[[i]] <- list(thisEvent)
        next
    }
    # Make a place to store each smaller event
    evList <- vector('list', length = length(thisStartEnd$start))
    for(s in seq_along(thisStartEnd$start)) {
        # Create each smaller event by filtering the whole event
        # to detections only between the start/end times we created earlier
        onePart <- filter(thisEvent, UTC >= thisStartEnd$start[s],
                          UTC < thisStartEnd$end[s])
        # Theres a chance this resulted in no detections, so if that happens
        # just skip to the next one
        if(is.null(onePart)) next
        # We need to assign this a new event ID or we'll have a bunch of repeats
        id(onePart) <- paste0(id(onePart), '_', s)
        evList[[s]] <- onePart
    }
    newEvents[[i]] <- evList
}
# Now that we are done, unlist everything so that we have a big list of
# AcousticEvents, we'll stick those into an AcousticStudy that's a copy
# of our original so we can compare our results
newEvents <- unlist(newEvents)
names(newEvents) <- sapply(newEvents, id)
shortStudy <- myStudy
events(shortStudy) <- newEvents
Done! Let’s compare our new AcousticStudy to what we started with to see what changed.
myStudy
shortStudy
noWarns <- checkStudy(shortStudy, maxLength = 120)
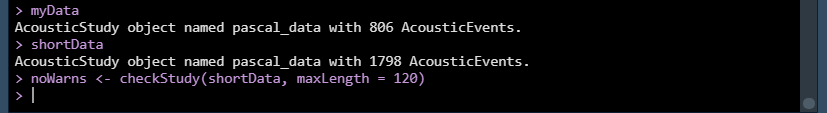
No more warnings! All our events are now under two minutes, and we’ve got over twice as many.
Case Study: Spectrogram Annotations as Events
Problem: We marked out some detections of interest using PAMGuard’s Spectrogram Annotation module, but there isn’t an easy way to read in only these detections.
Solution: We’ll use the function readSpecAnno from the PAMmisc package to read in
the Spectrogram Annotation tables, then use these tables as the event grouping files
for processing with mode='time'. This will get all detections that start within our
boxed times, then we can use the filter function to remove detections outside of
the frequency bounds of our boxes.
First let’s create a PAMpalSettings object like normal, then we can
use readSpecAnno to read in our Spectrogram Annotation tables.
dbFolder <- './Data/Databases'
bin <- './Data/Binary'
library(PAMpal)
pps <- PAMpalSettings(dbFolder, bin, sr_hz='auto', filterfrom_khz=10, filterto_khz=NULL, winLen_sec=.0025)

library(PAMmisc)
library(dplyr)
# Now we can get the database files out of the PPS we created
# If you named your SA table something else, provide that value in the table argument
specAnno <- bind_rows(lapply(pps@db, function(x) {
                        readSpecAnno(x, table='Spectrogram_Annotation')
                        }))
# If you only had one database, this code could also be simpler:
specAnno <- readSpecAnno(pps@db, table='Spectrogram_Annotation')
This function
will already apply most of the formatting we need to use it as a grouping file for
running processPgDetections with mode='time', it gives us columns id, start, end, and db.
It will also read in all other columns, so if you had used another field to store the species
ID you could then use that to create a new column species. You may also need to provide
the sample rate in your grouping file (see here).
# If you had the species stored somewhere, create a species column
specAnno$species <- specAnno$MySpeciesLabelColumn
# Optional, if needed
specAnno$sr <- 192e3
The data read in for each event may not end up being exactly what you expect. This will read in all detections whose start time lies between one of the annotation boxes you created, but this could be a detection that does not end within your box. It could also be a detection that is not within the frequency bounds of your box. There is also a chance that if your box bounds were not drawn very carefully you might be unintentionally excluding detections - if a detection starts slightly before your annotation box, it will not be included here. To deal with this last issue, one option is shift back the start times of your boxes by a very small amount. This could obviously also start including detections that you did not want, so be thoughtful when choosing a value (if you need one at all).
# If your boxes accidentally did not include the start of some signals, you can
# try shifitng their start times back by a small amount. Th
specAnno$start <- specAnno$start - .005
Now this is ready to pass on to processPgDetections!
data <- processPgDetections(pps, mode='time', grouping=specAnno, id='SpecAnnoCaseStudy')
Now we can work on filtering down on our detections to only contain ones that are entirely
contained within the boxes we drew. First we’ll deal with the frequency bounds. Whistles and
GPL detections have parameters freqBeg and freqEnd that are in units of Hz, and clicks have
a parameter peak that is in units of kHz (sorry for inconsistency!). The specAnno table also
has values fmin and fmax (units of Hz) that are read in from PAMGuard (I’ve renamed these from
f1 and f2 in the PAMGuard database), so we can use these values to do some filtering. When
processing with mode='time', PAMpal will store the relevant row of your grouping file in each
AcousticEvent’s ancillary slot for easier access. Whistle and GPL detections also have
duration parameter, we can use this to make sure each detection ends before our box does.
Here we’re going to loop through each event, grab the grouping info from the ancillary slot
(which contains the fmin and fmax values we want), then filter by the frequency parameters
PAMpal has measured for us. We need to use a loop to do the filtering (rather than just call
filter on data) because each event needs different filter values.
# Creating a copy to store the filtered so we can compare the 2, you don't need to do this
filtData <- data
for(i in seq_along(events(filtData))) {
    # get grouping info
    thisGroup <- ancillary(filtData[[i]])$grouping
    # Do filtering. Note fmin/max are in Hz, convert where appropriate
    filtData[[i]] <- filter(filtData[[i]],
                            freqBeg > thisGroup$fmin,
                            freqBeg < thisGroup$fmax,
                            freqEnd > thisGroup$fmin,
                            freqEnd < thisGroup$fmax,
                            UTC + duration < thisGroup$end,
                            peak > thisGroup$fmin / 1e3,
                            peak < thisGroup$fmax / 1e3)
}
Now let’s use the nWhistles function to compare how many whistles are in each event
before and after filtering.
# Comparing total numbers
nWhistles(data)
nWhistles(filtData)
# For each event
sapply(events(data), nWhistles)
# If some of these are 0, and you weren't expecting that, you may want to investigate
# those annotaitons in PAMGuard
sapply(events(filtData), nWhistles)