PAMpal
This is a package for processing passive acoustic data. Currently only supports data collected using Pamguard, but in the future we hope to support other platforms.
Note that this is currently a beta version, so some bugs and quirks are expected. Hopefully this guide will work you through the most common pitfalls, but please report any other issues to taiki.sakai@noaa.gov.
Our goal is to make your life easier, so if you have any other suggestions or feedback feel free to pass that along as well!
Using This Guide
This document is meant to be a resource to help you get started with PAMpal
for the first time, and then then the Next Steps section has
links with more in depth information and the more advanced capabilites of
PAMpal. This is also meant to be a complimentary
resource to the help files within R, so if you have questions about a specific
function you should first try ?function and then look here if that
doesn’t answer your question. Some images may have small text, you can click
on an image to open up a larger version.
Installation
PAMpal is available on CRAN and can be installed like any other package, but it receives frequent updates on GitHub that may not yet be on CRAN. To install the latest version from GitHub, first make sure that you have Rtools installed, then run the following code to install PAMpal.
# make sure you have Rtools installed
if(!require('devtools')) install.packages('devtools')
# install from GitHub
devtools::install_github('TaikiSan21/PAMpal')
Note that GitHub installation is much more prone to errors, so if you have any issues with that installation (or getting Rtools working properly), feel free to just install from CRAN.
Common Installation Issues
-
If you are getting errors related to
Unable to unload package 'ProblemPackage', try opening a fresh R session, or installing the package from the R console instead of RStudio. Sometimes R can have troubles updating package that are currently in use. -
If you see an error like
Error in strptime(xx, f, tz = tz) : unable to identify current timezone 'C', then run the codeSys.setenv(TZ = 'UTC')and try again. This is common on field laptops, or laptops where the timezone has been set manually to something other than the local timezone. -
If you see an error like
Error: Failed to install 'PAMpal' from GitHub: installation of package 'ProblemPackage' had non-zero exit status, or any other error message related to installing a non-PAMpal package, try installing the package “ProblemPackage” separately usinginstall.packages('ProblemPackage'). PAMpal relies on quite a few other packages, if any of them fail to install properly then PAMpal will not install. Sometimes a package will request to be “Installed from source”, try both options if it fails to install. -
If you see an error like
Error: (converted from warning) package 'ProblemPackage' was built under R version 4.0.3try updating R and installing again. I recommend using theupdateR()function from theinstallrpackage to update R. You may need to update “ProblemPackage” separately after updating, or if usingupdateR()it is usually a good idea to just update all of your packages (this can take a while). -
MacOS users may have some platform specific issues. I do not have access to a Mac, so cannot confirm how well solutions work but here are some options. If errors start with
xcrun: error: invalid active developer path, try the suggestions here. If an error likeError: .onLoad failed in loadNameSpace() for 'tcltk', try suggestions here
Quick Start Guide
PAMpal is currently only built to work with Pamguard, and is built to organize your acoustic detections into events. Before getting started you’ll need to have three things (plus one optional):
- The database (or multiple) created by Pamguard
- The folder containing containing the binary files (xxx.pgdf) created by Pamguard
- A way of organizing your data into events, either using Pamguard’s event or Detection Group Localizer modules, or by specifying start and end times (see guide for details on how to do this) (Optional) 4. The XML settings file exported from Pamguard (you need to do this manually, see here for more info). This is optional but highly recommended
Create a PAMpalSettings Object
Once you have these ready, the first step to using PAMpal is to create a
PAMpalSettings object (PPS) using the PAMpalSettings() function. You can call this
function with no arguments and pop-up menus will walk you through the rest:
myPps <- PAMpalSettings()
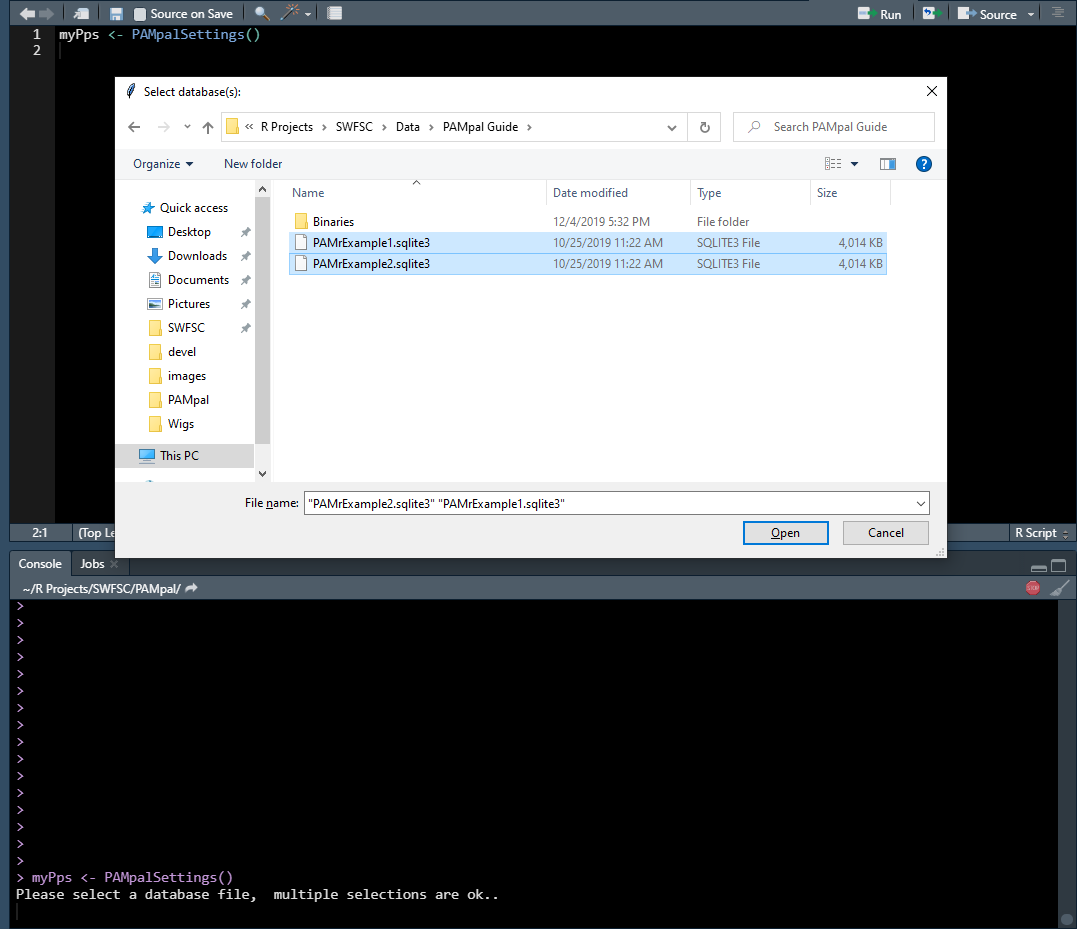
First you will be asked to select the database files. You can select more than one using CTRL or SHIFT. Don’t worry - you can add or remove databases later, nothing here is final.
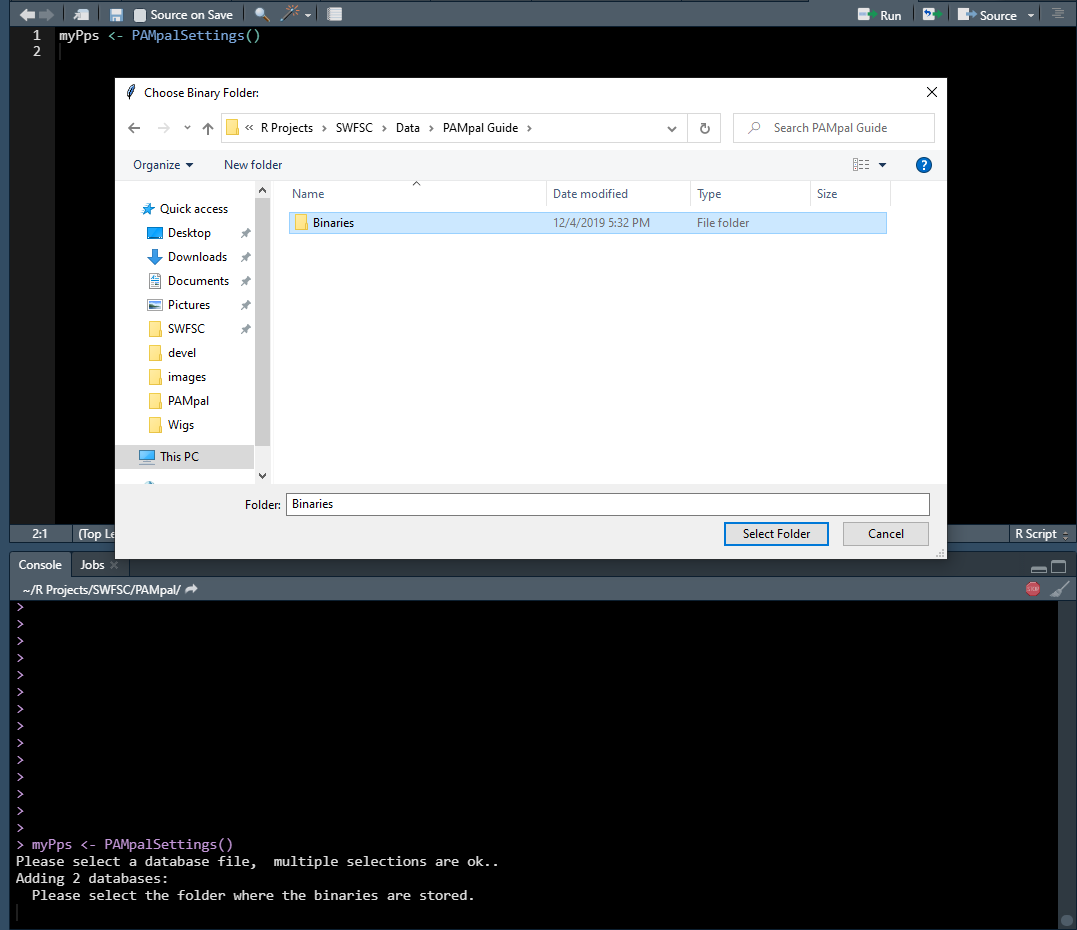
Next you will be asked to select a folder containing the binary files. You can just select the highest level folder and PAMpal will search through all the sub-folders for any .pgdf files (ie. it is okay to select “Binaries” instead of “20040828” in the image below).
NOTE: Sometimes the selection windows don’t pop up in front of your R session, if you don’t immediately see the file selection window for either of these two steps then look for it with ALT+TAB.
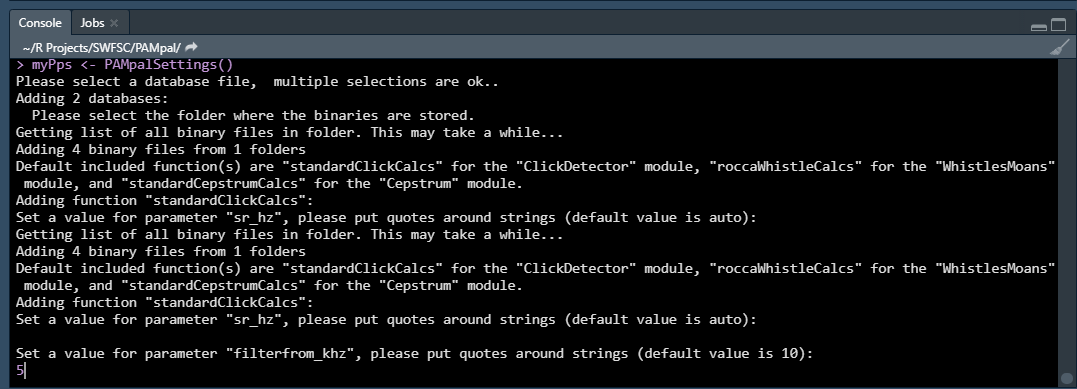
Next you will be asked to set some parameters for the processing functions that come with PAMpal. There is one function for each of four types of detections - clicks, whistles, cepstrum, and GPL detections. See here for more information.
The only function you need to set parameters for is the “standardClickCalcs” function. You can either enter a new value for the parameter it is asking you to set, or just pressing ENTER will use the default value (the default value is shown. There are three parameters you will be asked to set (more details found here):
- “sr_hz” - the sample rate in hertz for the click data. This should be kept to the default value of “auto” (just press ENTER) unless your click data was decimated, in which case enter the decimated sample rate. This is not necessary if you will add an XML settings file (described more below)
- “filterfrom_khz” - the value in kilohertz of the butterworth highpass filter, or if a bandpass filter is desired (see next item) the lower end of the filter. If this value is 0 then no filter will be applied.
- “filterto_khz” - if a bandpass filter is desired, this is the upper bound of the filter. If a highpass or no filter is desired, leave as the default NULL (just press enter)
- “winLen_sec” - the length of the FFT window to use for analysis, in seconds
NOTE: You will need to enter these values in the R Console, so if you are running
PAMpalSettings() from a script you need to either click in the console before typing
or use the shortcut CTRL+2.
Once you’ve finished entering values for these (or accepting the defaults), there
is just one more optional (but recommended) step. More recent version of Pamguard
have the ability to export some module settings as an XML file, and this XML
file can be added to your PAMpalSettings object to help PAMpal process data more
accurately and also to keep a record of your Pamguard settings in R. For more
details on how to get this XML file, see the “Adding XML Settings” here.
If you already have this file, it is easily added with the function addSettings.
Again, this step is optional, so feel free to skip if this is your first time trying
PAMpal and you just want to see how things work. But it is highly recommended when
you are more familiar and want to really start processing data.
myPps <- addSettings(myPps, 'XMLSettings.xml')
Once you’ve added some settings (or skipped that step), you’re ready to process some data! For more details about the PPS, including adding or removing data and functions, or ways to set up a PPS without the interactive parts, see the PAMpalSettings page.
Processing Your Data
Once you have a PPS, processing your data is easily accomplished by calling
the processPgDetections function. This function has three modes, mode = 'db'
for processing events labeled within Pamguard, mode = 'time' for events
labelled by start and end times, and mode = 'recording' to organize data
by wav file. For mode = 'db', you can just run:
myStudy <- processPgDetections(myPps,
                               mode='db',
                               id='MyStudyName')
Note that if id is not specified it will default to today’s date, but it is
always recommended to provide an informative name.
For mode = 'time', you will also need to supply your event data, see this guide
or ?processPgDetections for details on how this should be formatted:
myStudy <- processPgDetections(myPps,
                               mode='time',
                               id='MyStudyName',
                               grouping='myEvents.csv')
For mode = 'recording' you don’t need to supply any extra information. This is the most
straight forward way to have PAMpal process all possible detections with minimal effort.
NOTE: When running mode='time', you may be prompted to make some decisions about matching
databases and events, or have issues converting dates from a csv file. See here
for more details about what’s going on.
myStudy <- processPgDetections(myPps,
                               mode='recording',
                               id='MyStudyName')
And you’re done! Let’s take a look at what you got with one of PAMpal’s built in plotting functions,
plotDataExplorer. After calling plotDataExplorer(myStudy), a window will pop up with the shiny
app that should look like this:
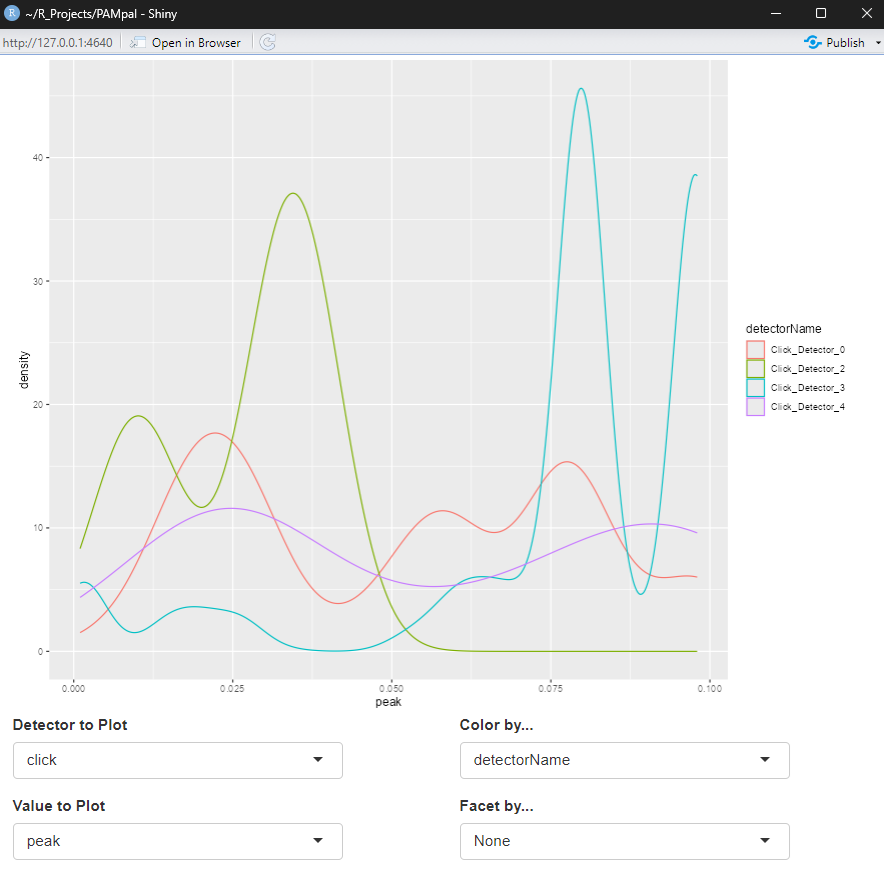
The boxes below the plot are dropdown menus that let you select what type of detection to plot data for, which parameters to plot, and options for coloring and facetting (splitting into multiple plots) are also present.
Plots are pretty and all, but what did PAMpal actually do and what exactly is in your myStudy
output object? For each detection in each of your events, PAMpal checks what type of detection
it is and then applies all of the functions you have added for that type. For the default options
we have just one function each for clicks, whistles, cepstrum, and GPL detections, but you could add more.
These outputs are grouped by the detector that detected them, and by the event that you are a part of.
For details on how to easily get your data out into a dataframe see the Next Steps
section.
You might have noticed that myStudy is not a normal R list or data frame, it is a custom R object
called an AcousticStudy (an S4 class, if you’re into that sort of thing). This means that actually
getting at your data is slightly trickier than you might be used to, but it lets PAMpal do lots of
useful things. For example, this AcousticStudy object keeps track of all the files you used for
this analysis, as well as a copy of the PPS object you used to construct it. This means that when
you come back to an analysis a year later, you don’t need to try and remember exactly what data
you analysed or what parameters your processing functions had, PAMpal does that for you. It also means
that if you send this object to a colleague, they can see exactly what you did to get your results
AND they can even use the exact same functions you used to process their own data! For more on
how PAMpal makes collaboration easy, see this page, and for more details on working
with AcousticStudy objects see here.
And that’s it for the basics of using PAMpal! Check out the next section for links to help with specific topics, like how to use PAMpal to format your data for machine learning models or for more nitty gritty details about the S4 objects that power it. And reach out if there’s anything you can’t find, or if there’s anything else you want PAMpal to do!
Next Steps
To learn more about what PAMpal can do for you, click on the links below
- Parallel Processing As of version 1.4.0,
PAMpalcan benefit from parallel prcoessing to reduce analysis time - Data processing: Next steps Adding GPS data, assigning species ID, more info on how to access and manipulate your data, and much more
- Case Studies Some tutorials of working through a specific problem,
great for examples of manipulating
AcousticStudyobjects and seeing how to program with your data
More information
- More about the PAMpalSettings object - Topics include adding and removing data / functions from your PPS, adding a hydrophone calibration, and more details about what exactly is stored here.
- Parameter calculation details - Details on how the parameters from the included processing functions are calculated
- Grouping events by start and end time - More details on the information required for the CSV file to group your events by start/end time
- A guide to getting started with BANTER (also see the section on exporting data for BANTER in next steps)
- Creating custom functions How to create custom functions to add to your PPS. We don’t claim to have all the answers in our provided “standard” functions, we want you to add your own ideas!
Sections below are still under construction
- More details about the AcousticStudy and AcousticEvent objects
- Collaboration More details on how PAMpal makes it easy to collaborate
- Common error messages A (probably incomplete) list of some warning and error messages you might encounter, why they are happening, and what to do about them
- Currently in development See what is currently in development, as well as some possible future ideas that we hope to get to
Contact
Feel free to reach out with any questions, comments, suggestions: taiki.sakai@noaa.gov
Versions
For bug fixes and feature additions in each version see the NEWS file